878 Sessions, 52.9k Tool Calls — What a Year of Vibe Coding Looks Like
vibe-replay now tracks your AI coding activity across machines and tools. GitHub-style heatmaps, streak tracking, model usage breakdowns — and shareable public profiles.
I’ve been vibe coding for 399 days. 878 sessions across Claude Code and Cursor. Until recently, I had no idea what my patterns looked like — which models I gravitate toward, which days I’m most productive, whether I’m speeding up or slowing down.
Now I do. vibe-replay’s new Personal Insights feature turns your local AI session history into a full analytics dashboard — synced across machines, with optional public sharing.
Your coding year, at a glance
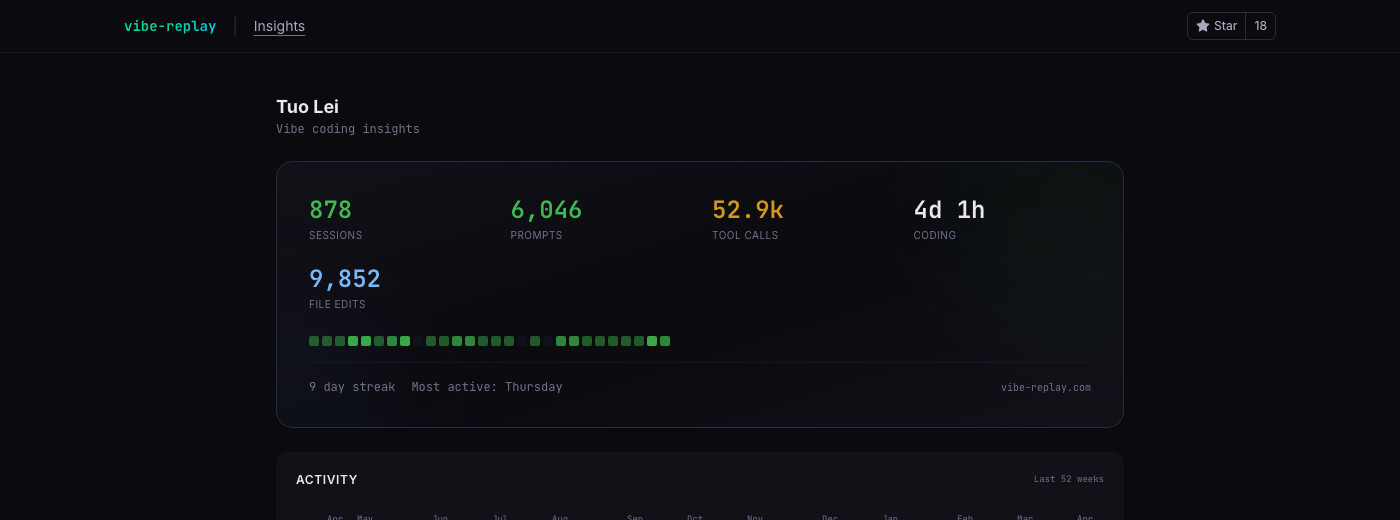
The top of the insights page shows your aggregate stats: total sessions, prompts, tool calls, time spent, and file edits. Below that, a mini heatmap shows your last 4 weeks of activity — a quick pulse check before you scroll into the details.
My numbers after 399 days:
| Metric | Value |
|---|---|
| Sessions | 878 |
| Prompts | 6,046 |
| Tool calls | 52.9k |
| File edits | 9,852 |
| Total coding time | 4 days, 1 hour |
That’s roughly 7 prompts per session, averaging about 7 minutes each. Short, focused bursts — not marathon sessions.
The contribution heatmap
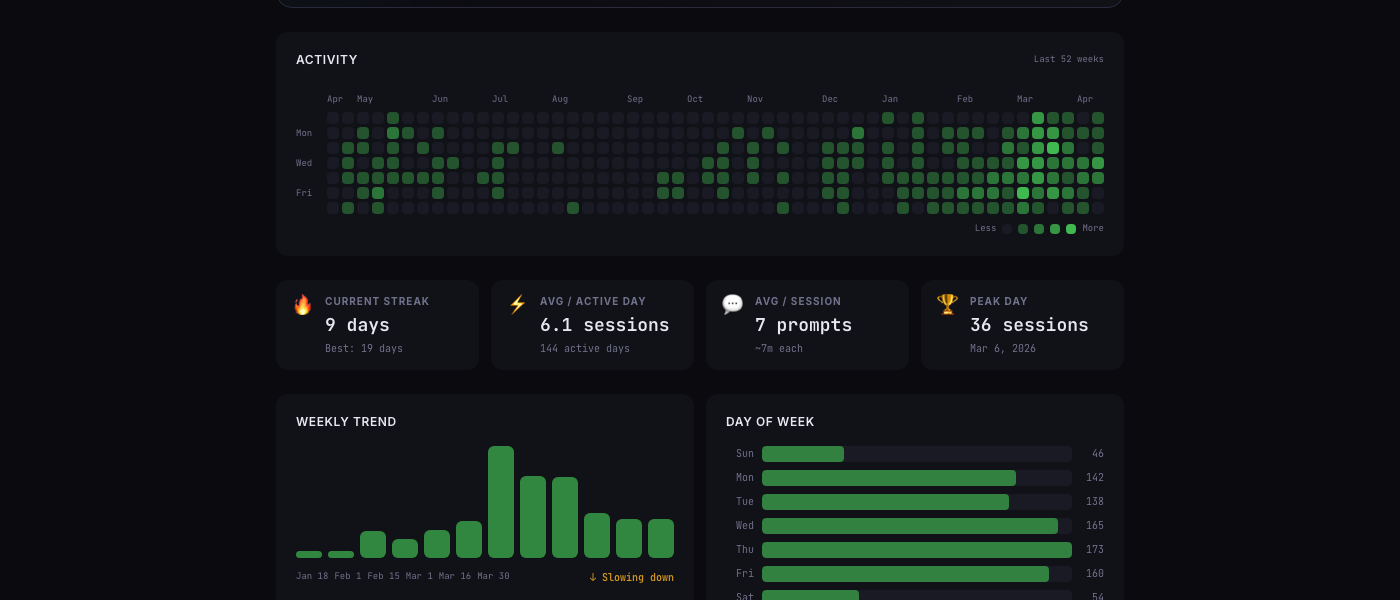
If you’ve used GitHub, this looks familiar. Each cell is a day, colored by how many sessions you ran. The full year view reveals patterns that individual sessions hide:
- The sparse July–December 2025 stretch is misleading — I was actively vibe coding with Claude Code during that period, but Claude Code only retains JSONL files for 30 days. By the time I started capturing data with vibe-replay in March 2026, months of sessions had already been cleaned up. The Cursor sessions from that era survived because Cursor stores them in SQLite databases that persist indefinitely.
- Activity appears to ramp up around October 2025 — partly real (that’s when I started building vibe-replay), partly an artifact of data loss
- The densest weeks are in February–March 2026, with multiple high-intensity days — this is the period where I had full coverage from both providers
- Saturday is consistently the quietest day (54 sessions vs. Thursday’s 173)
This is exactly why the persistent local store matters. Once vibe-replay captures your session metrics, they’re safe — even after Claude Code’s 30-day cleanup or Cursor’s transcript deletion.
The streak cards below the heatmap add context: 9-day current streak, best of 19 days, averaging 6.1 sessions on active days. The peak day — March 6, 2026 — had 36 sessions in a single day.
Weekly trends and day-of-week patterns
The weekly trend chart tells a story the heatmap compresses. You can see activity building through February and peaking in mid-March. The “Slowing down” label is auto-generated — it compares the last two weeks against your 90-day average.
The day-of-week breakdown confirms what I suspected: weekdays are roughly equal (138–173 sessions), but Saturday drops to a third of Thursday’s volume. Sunday is even lower. Vibe coding is, for me at least, a weekday activity.
Which models do you actually use?
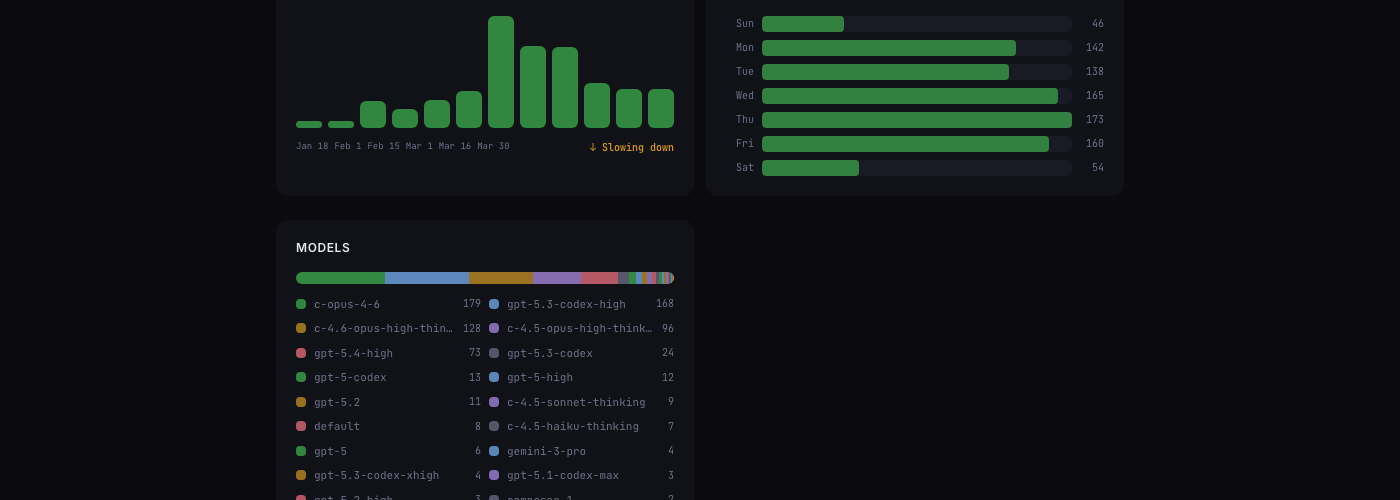
This was the most surprising section. I expected to be a Claude-heavy user. The data says otherwise:
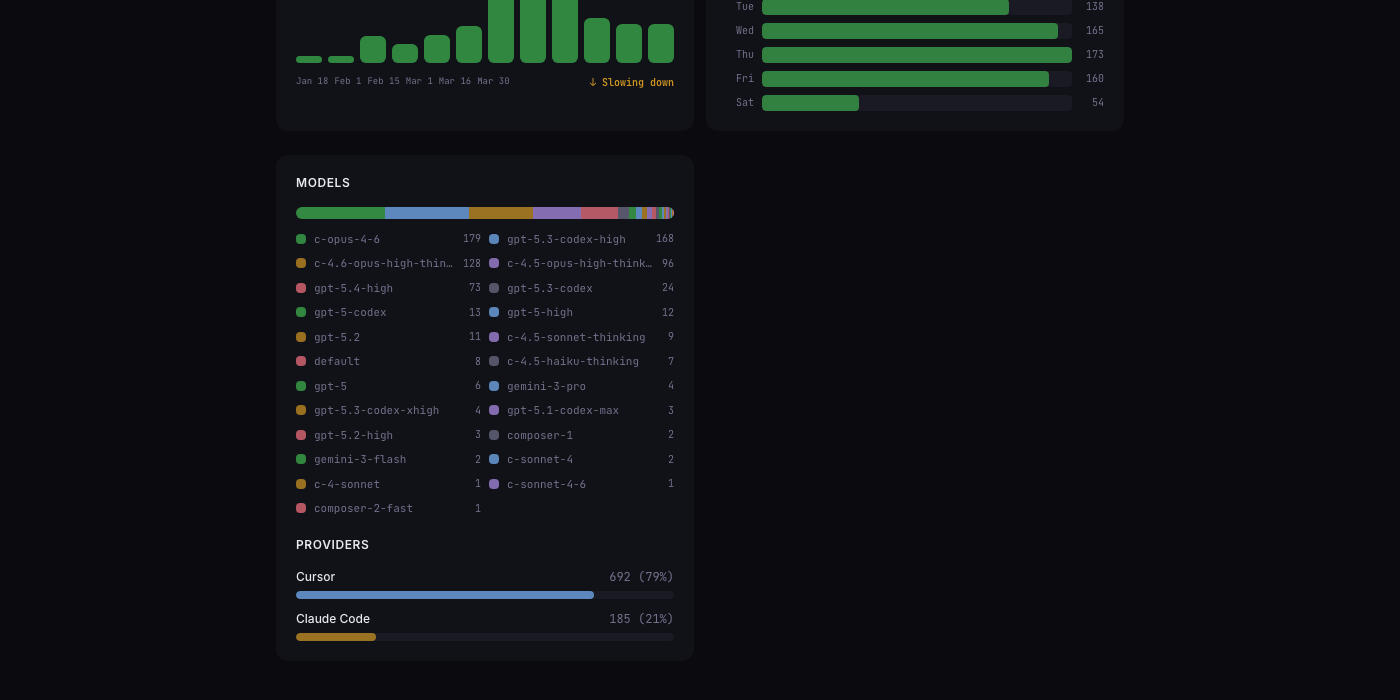
- c-opus-4-6 leads with 179 sessions — my primary Claude Code model
- gpt-5.3-codex-high is a close second at 168 — Cursor’s default workhorse
- The long tail is remarkable: 20+ distinct models across Claude, GPT, and Gemini families
The provider split makes it clear: 79% Cursor, 21% Claude Code. I use Cursor for quick edits and exploratory work, Claude Code for heavy-lifting sessions that need agentic depth. The insights page makes this split visible for the first time.
How it works under the hood
Personal Insights operates in three layers:
Local store — Every time you run npx vibe-replay, session metrics are persisted to ~/.vibe-replay/insights/store.json. Claude Code deletes JSONL files after 30 days. Cursor can lose transcripts across updates. I learned this the hard way — months of Claude Code sessions from mid-2025 are gone forever because I didn’t have a persistent store yet. The local insights store solves this: once captured, your data survives regardless of what the AI tools do with their own files.
Cloud sync — If you sign in, daily aggregates sync to a lightweight time-series store (one row per machine per day). Delta sync means only new or modified days are uploaded. Multi-machine usage merges automatically.
Public profiles — Optionally share your insights with a public URL. Privacy controls let you hide cost data, blur project names, or disable individual sections. The profile is read-only — viewers see exactly what you choose to show.
Share your vibe coding profile
Every user gets a shareable URL: vibe-replay.com/shared-insights/?s=your-slug (or the short form vibe-replay.com/i/your-slug).
The privacy defaults are conservative — dollar amounts are hidden (model names and session counts are still visible), projects are visible but can be blurred, and you can toggle every section independently. Think of it as a GitHub contribution graph, but for AI-assisted coding.
Try it
npx vibe-replaySign in from the dashboard, and your insights page builds automatically from your local session history. No manual tracking, no configuration. If you’ve been vibe coding with Claude Code or Cursor, the data is already on your machine — insights just surfaces it.