What Does Claude Code Store Locally? A ~/.claude/ Deep Dive
Claude Code stores session history, tool calls, file snapshots, and usage data under ~/.claude/. Here's where the files live and how to inspect them safely.
Run this right now:
du -sh ~/.claude/The result is machine-specific. A busy installation can grow quickly because the directory may contain transcripts, tool results, file snapshots, images, and indexes. The examples in this post are synthetic; use the commands against your own data instead of treating any number here as a benchmark.
Most Claude Code users never look inside this directory. It is worth inspecting when you need to understand retention, recover a file version, or build analytics that the terminal UI does not provide. vibe-replay reads these local sources and turns them into a navigable replay.
Where are Claude Code sessions stored?
Every Claude Code session is typically represented under ~/.claude/projects/ as a plain-text JSONL file. Depending on the release and session type, a record can include prompts, tool calls, file edits, images, metadata, and reasoning or thinking blocks when those are persisted.
Claude Code has a built-in /resume command that lets you browse past sessions and continue them. And /stats gives you a quick overview of your usage history. But both are scoped to the current terminal — you can’t search across sessions, compare them, or see what happened inside.
vibe-replay reads these same files and turns them into a browsable dashboard — organized by project, with activity charts, tool call counts, and cost estimates:
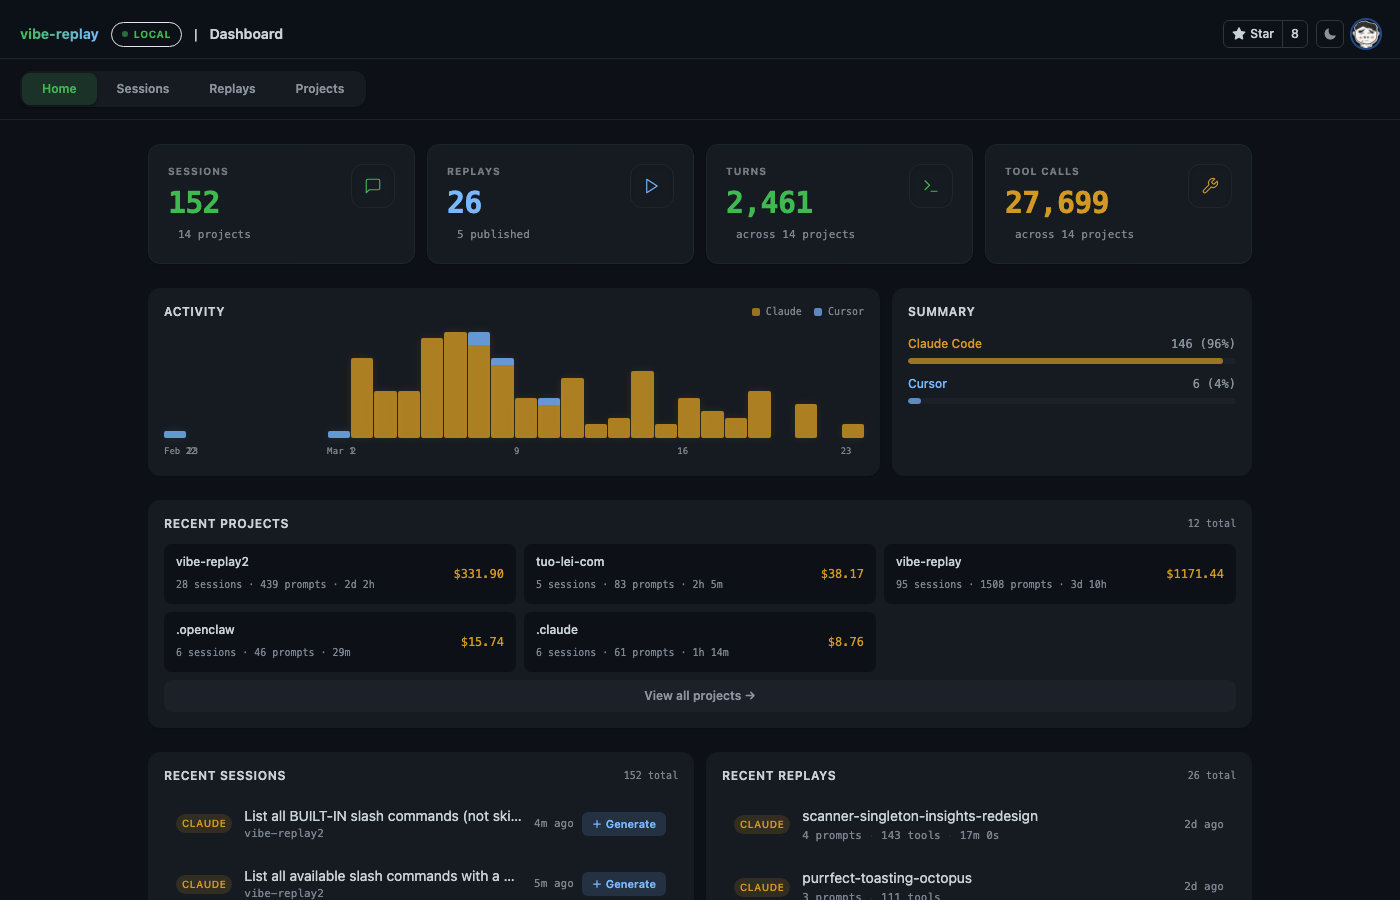
From here you can click into any session to replay it turn by turn, or drill into a project to see aggregated stats across all its sessions.
How much does Claude Code actually cost? (And how much does caching save?)
Claude Code has /cost to show token usage for the current session, and /usage to show your plan limits. Both are useful in the moment.
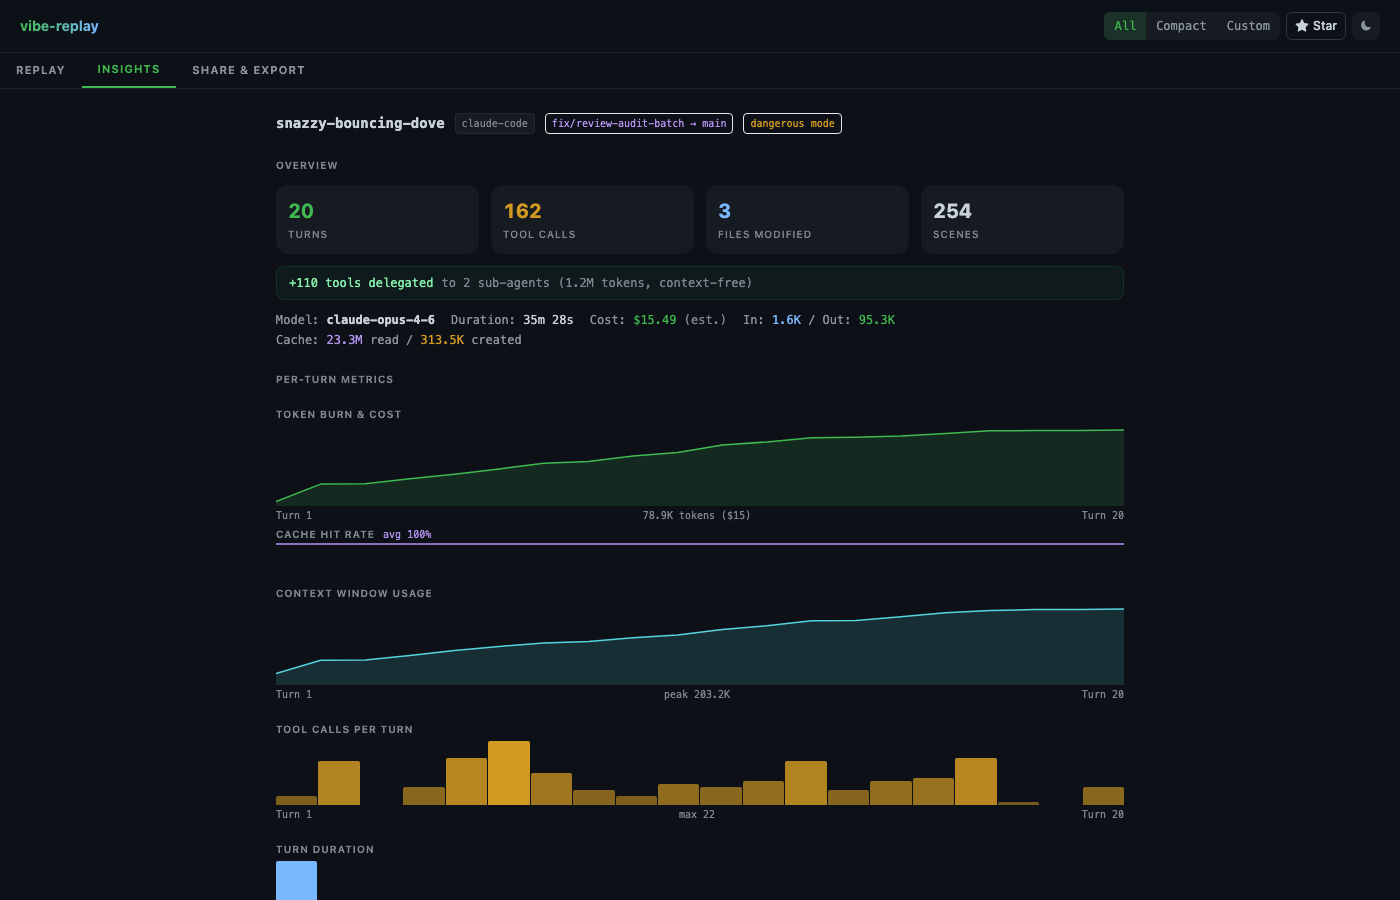
Assistant records often include token counts in the JSONL — input, output, cache creation, and cache read. Aggregate the records across sessions and you get a picture neither command shows you:
| Metric | Why it matters |
|---|---|
| Cache read tokens | Shows how much input was served from the prompt cache |
| Cache hit rate | Helps explain why repeated context can be cheaper than fresh input |
| API-equivalent cost | A model- and pricing-dependent estimate, not a subscription bill |
| Cost without caching | A useful counterfactual for understanding cache impact |
Do not confuse an API-equivalent estimate with an invoice or a subscription charge. Pricing changes, model aliases differ, and some records are incomplete. Treat the cache ratio as an observation from the stored usage fields, and label any derived cost as an estimate.
In vibe-replay, the Insights tab calculates this per session automatically — cost per turn, cumulative token burn, cache hit rate, and context window growth:
The CLI way (aggregate across all sessions — requires jq):
jq -s '[.[] | select(.type=="assistant") | .message.usage // empty] |
  { cache_read: (map(.cache_read_input_tokens // 0) | add),
    cache_create: (map(.cache_creation_input_tokens // 0) | add),
    output: (map(.output_tokens // 0) | add) }' \
  ~/.claude/projects/*/*.jsonl 2>/dev/null
Why does Claude Code forget things mid-session?
Context compaction. As a session progresses, every message, tool result, and file read adds tokens to the context window. When it hits the limit, Claude Code summarizes the conversation and restarts with a compressed version. This is why Claude sometimes “forgets” what you discussed earlier.
Claude Code gives you /context to see a colored grid of how full your context window is right now, and /compact to manually trigger compaction when you feel the context getting stale.
But neither tells you what happened historically. In vibe-replay’s Insights panel, you can watch it visually — the context window chart shows steady growth, then a sharp drop at compaction. When a provider records pre-compaction usage, the replay can show that boundary without pretending the number is the model’s exact internal context size.
Across a collection of sessions, the same view makes compaction events easier to compare. A compaction boundary explains that context was summarized; it does not by itself prove that the model “forgot” a particular fact.
The CLI way:
jq 'select(.type=="system" and .subtype=="compact_boundary")
  | {trigger: .compactMetadata.trigger, preTokens: .compactMetadata.preTokens}' \
  ~/.claude/projects/*/*.jsonl 2>/dev/null
What tools does Claude Code use most?
It is easy to assume Claude Code mostly reads and edits files. The data tells a different story:
| Tool family | What it often represents |
|---|---|
| Bash | Shell inspection, tests, builds, and version-control commands |
| Read | File and directory inspection |
| Edit / Write | Applying source changes |
| Grep | Searching the codebase |
| Agent | Delegated work in a separate context |
In many agent-heavy sessions, Bash is one of the largest categories because the model uses shell commands for discovery, tests, builds, and version-control checks. The exact distribution depends on the task, permissions, and enabled tools, so compare sessions rather than treating one histogram as a universal benchmark.
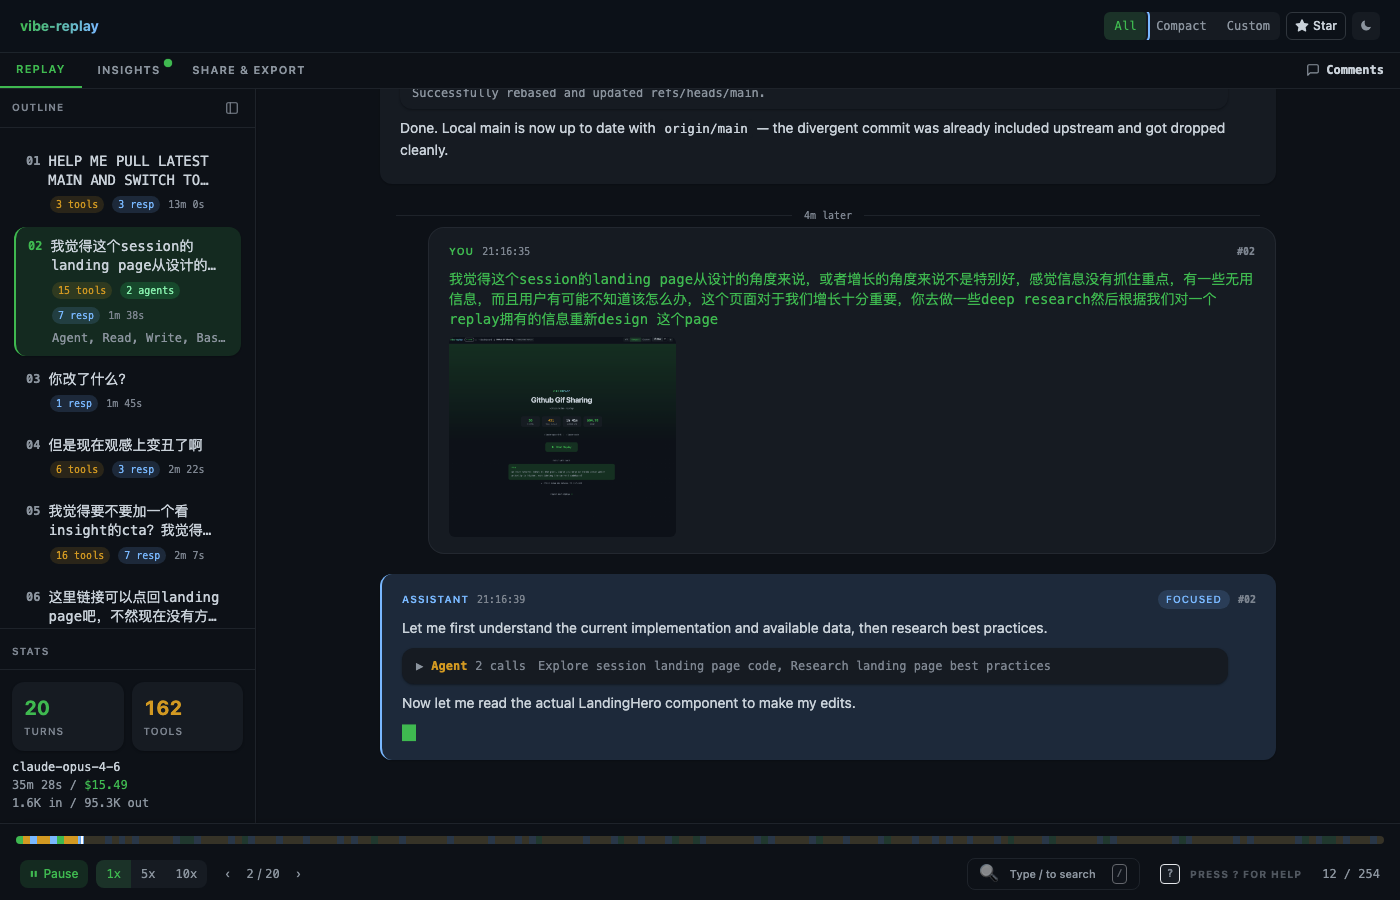
In the vibe-replay replay view, you can watch this play out in real time — what command Claude ran, what the output was, what it decided to do next:
The CLI way:
jq -r 'select(.type=="assistant") | .message.content[]?
  | select(.type=="tool_use") | .name' \
  ~/.claude/projects/*/*.jsonl 2>/dev/null | sort | uniq -c | sort -rn
What are Claude Code sub-agents, and what do they actually do?
When Claude Code spawns a sub-agent (via the Agent tool), you see a spinner and then a result. But behind that spinner, the sub-agent might run 50+ tools — reading files, searching code, running commands — all in its own context window.
A sub-agent can create its own JSONL conversation and a small metadata record:
{
  "agentType": "general-purpose",
  "description": "Review a module for duplicated logic"
}
In vibe-replay, sub-agent work is expandable inline — you can open one up and see what it was tasked with, which tools it ran, and what it returned. It is a hidden layer of work that a final diff normally leaves out.
Does Claude Code record every prompt you type?
Often, but do not treat it as a guaranteed audit log. ~/.claude/history.jsonl is a global prompt index across projects:
{
  "display": "Review the authentication flow",
  "timestamp": 1772598497513,
  "project": "/home/example/project",
  "sessionId": "session-demo-..."
}
This index can become a chronological record of AI-assisted work — what you asked, when, and in which project. It may be incomplete or shaped by provider version and cleanup behavior. If you pasted something, that may be recorded too; large pastes can be stored separately in ~/.claude/paste-cache/. Treat both locations as sensitive.
# Try it — how many prompts have you typed?
wc -l ~/.claude/history.jsonl

# Breakdown by project
jq -r '.project' ~/.claude/history.jsonl | sort | uniq -c | sort -rn
Can you recover files that Claude Code changed?
Yes. Start with /rewind — Claude Code’s built-in command to roll back your conversation and code to a previous checkpoint.
But there’s a deeper layer. Before every edit, Claude Code saves a snapshot to ~/.claude/file-history/, organized by session with versioned copies:
file-history/<session-uuid>/
├── 12e0d72e037caf5f@v1    # src/auth.ts before first edit
├── 12e0d72e037caf5f@v2    # before second edit
├── 12e0d72e037caf5f@v3    # before third edit
In the observed layout, the filename is a truncated SHA-256 of the file’s absolute path. You can locate snapshots for any file directly, but treat the naming rule as an implementation detail:
HASH=$(echo -n "/home/example/project/src/auth.ts" | shasum -a 256 | cut -c1-16)
ls ~/.claude/file-history/*/${HASH}@*
These snapshots can preserve earlier file contents even after a conversation moves on. Retention and cleanup behavior can vary, so do not treat them as a guaranteed backup.
What else is in ~/.claude/?
- Shell snapshots (
shell-snapshots/) — periodic snapshots of shell state used to reproduce the command environment. They can contain sensitive environment values. - Reasoning and thinking blocks — some sessions persist model reasoning or thinking metadata. The presence, completeness, and format depend on the provider and version; never assume a transcript contains the full internal process.
- Embedded images — images may be stored as data inside session records, which can make a transcript much larger than its text suggests.
- Pull-request metadata — sessions can include links or records for repository actions. Review these before sharing an export.
How can I visualize all of this?
Claude Code’s built-in commands are a good starting point: /cost for current session costs, /context for context window status, /stats for usage history. Use them.
For the full picture — token burn over time, context window growth, tool distribution, sub-agent internals, thinking blocks, every file edit as a navigable timeline:
npx vibe-replayOne command. It discovers supported local providers, you pick a session, and it generates a self-contained HTML replay. No server or account is required for local use, and the replay makes no automatic external requests. Remote images load only after an explicit click. Open it in any browser, share it with your team, or publish it to the cloud.
Your ~/.claude/ directory is a goldmine. Stop grepping through JSONL.